Identifying Color Differences Using L*a*b* or L*C*H* Coordinates
Even if two colors look the same to one person, slight differences may be found when evaluated with a color measurement instrument. If the color of a sample does not match the standard, customer satisfaction is compromised and the amount of rework and costs increase. Because of this, identifying color differences between a sample and the standard as early in the production process as possible is important.
Color difference can be defined as the numerical comparison of a sample’s color to the standard. It indicates the differences in absolute color coordinates and is referred to as Delta (Δ). These formulas calculate the difference between two colors to identify inconsistencies and help users control the color of their products more effectively.
To begin, the sample color and the standard color should be measured and the values for each measurement saved. The color differences between the sample and standard are calculated using the resulting colorimetric values.
Identifying Color Differences Using CIE L*a*b* Coordinates
Defined by the Commission Internationale de l’Eclairage (CIE), the L*a*b* color space was modeled after a color-opponent theory stating that two colors cannot be red and green at the same time or yellow and blue at the same time. As shown below, L* indicates lightness, a* is the red/green coordinate, and b* is the yellow/blue coordinate. Deltas for L* (ΔL*), a* (Δa*) and b* (Δb*) may be positive (+) or negative ( -). The total difference, Delta E (ΔE*), however, is always positive.
ΔL* (L* sample minus L* standard) = difference in lightness and darkness (+ = lighter, – = darker)
Δa* (a* sample minus a* standard) = difference in red and green (+ = redder, – = greener)
Δb* (b* sample minus b* standard) = difference in yellow and blue (+ = yellower, – = bluer)

Let’s compare Apple 1 to Apple 2 (see Figure 1).

Figure 1
Looking at the L*a*b* values for each apple in Figure 1, we can objectively determine that the apples don’t match in color. These values tell us that Apple 2 (sample) is lighter, less red, and more yellow in color than Apple 1 (standard). If we put the values of ΔL*=+4.03, Δa*=-3.05, and Δb*=+1.04 into the color difference equation, it can be determined that the total color difference between the two apples is 5.16.
5.16 = [4.03^2 + -3.05^2 + 1.04^2] ^1/2
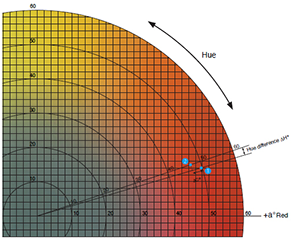
Identifying Color Differences Using CIE L*C*H* Coordinates
The L*C*h color space is similar to L*a*b*, but it describes color differently using cylindrical coordinates instead of rectangular coordinates. In this color space, L* indicates lightness, C* represents chroma, and h is the hue angle. Chroma and hue are calculated from the a* and b* coordinates in L*a*b*. Deltas for lightness (ΔL*), chroma (ΔC*), and hue (ΔH*) may be positive (+) or negative ( -). These are expressed as:
ΔL* (L* sample minus L* standard) = difference in lightness and darkness (+ = lighter, – = darker)
ΔC* (C* sample minus C* standard) = difference in chroma (+ = brighter, – = duller)
ΔH* (H* sample minus H* standard) = difference in hue
Let’s compare Apple 1 to Apple 2 (see Figure 2).
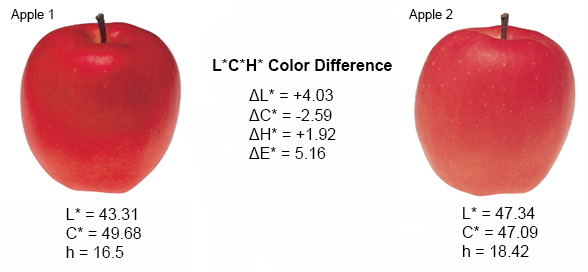
Figure 2
Looking at the L*C*h values for each apple in Figure 2, we can objectively determine that the apples don’t match in color. Like the L*a*b* values, these values tell us that Apple 2 (sample) is lighter and duller in appearance than Apple 1 (standard). The positive ΔH* value of +1.92 indicates Apple 2 falls counterclockwise to Apple 1 in the L*C*h color space. This tells us that Apple 2 is less red than Apple 1.
Color measurement instruments, such as colorimeters and spectrophotometers, can detect differences indiscernible to the human eye and then instantly display these differences in numerical terms. After identifying color differences using L*a*b* or L*C*h values, it should be decided whether the sample is acceptable or not using tolerance limits.
This article is part of the foundation of color science. To learn how to measure color differences please Download our Whitepaper: Colorimetry