When You May Want a Spectral Based Meter, Rather Than a Tristimulus Meter
In some special cases, the tristimulus meter may still be preferred, most likely when there is no way to increase the amount of light, and the spectral meter is not fast enough.
In these cases it possible to “adjust” the tristimulus meter to read more accurately by first measuring the light source with an accurate spectral based instrument and then transferring those values into the tristimulus meter. The tristimulus meter will then measure that type of light source much more accurately. This process has several names such as: custom calibration, customer calibration, and correction factor.
| Meter Type | Tristimulus | Spectral |
|---|---|---|
| Measurement Speed | Fast | Slower |
| Cost | Less Expensive | More Expensive |
| Size | Small | Bigger |
| Error with Discontinuous Light | 1~10% | <2% |
Tristimulus
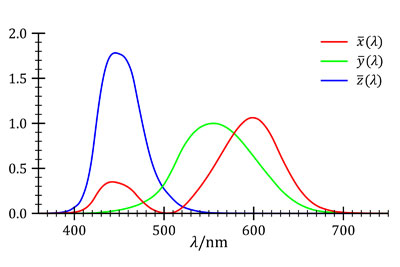
Tristimulus detectors are modeled after the eye, consisting of three detectors, with a special color matching filter in front of each. The filters/functions are defined as the CIE 1931 XYZ standard observer color matching functions.
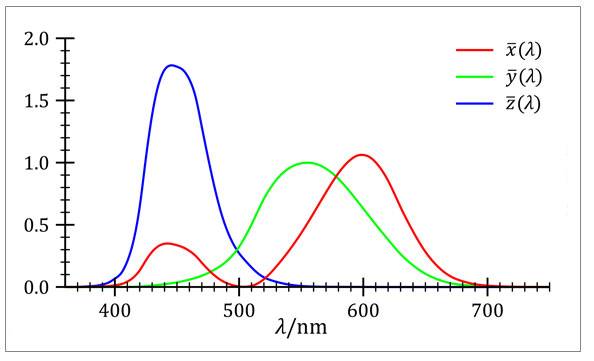
Like the eye, they are excellent at measuring “continuous” light sources that have light at all visible wavelengths. The eye is optimized to view natural light coming from burning objects (black bodies) like the sun and fire. Close approximations are the incandescent lamp, warm fluorescent lamp, and white LED (2700K). However with narrowband sources, or “discontinuous” sources, measurement error increases.
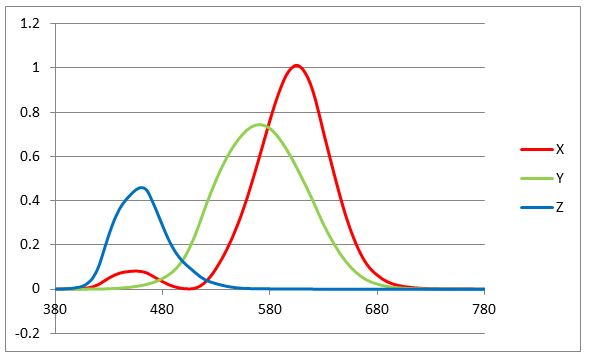
Continuous versus Discontinuous Light sources.
Compare the two graphs. The first represents the normalized calculated spectral output of a 2856 Kelvin incandescent lamp, using the color matching functions. Notice the curves look very similar in shape to the original above. They mostly just vary in size.
The next graph represents a LED peaking at 420nm (this value was intentionally chosen to maximize the error). The X and Z curves are very small compared to the Y, and they are shifted or distorted in shape. This situation will produce high measurement error.
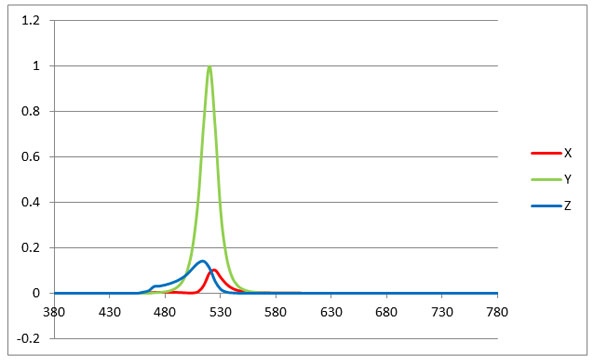
Keep in mind these graphs show data from 380nm to 780nm spaced every 1 nm. That is 780-380+1 or 401 data points. This data is only available from a spectral based instrument. The tristimulus meter reports just 3 data points. Therefore, it does not detect all these subtle changes.