

Colorimetry
Colorimetry
Color
Color is a characteristic of light determined by the light’s spectral composition and the interaction with the human eye. Hence, color is a psychophysical phenomenon, and perception of color is subjective.
Color Perception
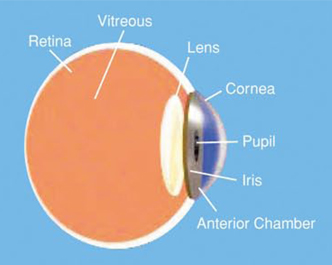
The eye acts much like a camera, with the lens forming the image of the scene on the light-sensitive retina. There are several kinds of light detectors, called rods and cones. The cones are grouped into three types, each responds to a portion of the spectrum, with peak responses corresponding to blue, green, and red light. The interaction of these groups is then responsible for the stimulus which is interpreted by the brain as color. This widely accepted theory on color vision is known as Trichromatic Theory.
Mixing of Colors
Issac Newton first demonstrated and explained the composition of white light, by refracting it through a glass prism into its constituent spectral colors. If colored lights are added, this implies that different lights with different spectral colors composition are added. The resultant effect on the brain can be any of the spectral colors located in the visible spectrum, for example, yellow, or a non-spectral color which does not appear in the spectrum as monochromatic light, for example, purple. Creation of colors by addition of colored lights is known as additive mixing. It is found that the eye behaves as though the ‘outputs’ of the three types of cones are additive.
Figure 2.4.3a illustrates the resultant color effect of mixing three colored lights, red, green, and blue. The red, green, and blue can be called the primaries and the resulting yellow, cyan, and magenta the secondaries.
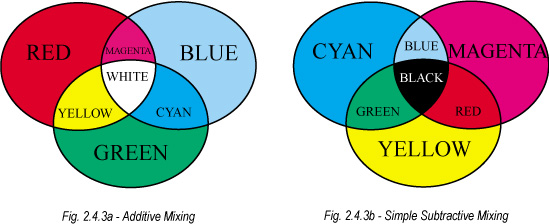
The color of an object is determined by pigments. These are chemicals which create a given color by subtracting parts of the spectrum of the incident light. The remaining light is reflected and this gives the object its color characteristic.
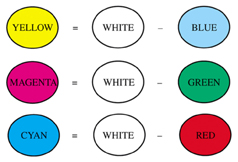
Making colors by mixing paint pigments may therefore be described as a process of subtractive mixing (refer to fig. 2.4.3b), since each added pigment subtracts more from the incident light and leaves less to be reflected into the eye. Following are some examples (the incident light in this example is white):
Light Source Color Specification
In the past, various people have devised methods to quantify color so that communication of color becomes easier and more accurate. These methods attempt to provide a way of expressing color numerically, in much the same way we express length and weight.
Light source color specification and measurement can be categorized into three major colorimetric methods. They are:
- Tristimulus colorimetry
- Color temperature
- Spectroradiometry
Tristimulus Colorimetry
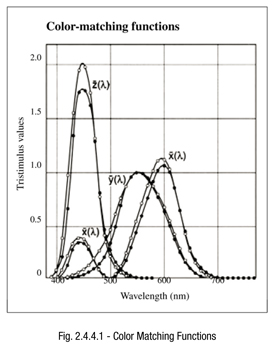
Tristimulus colorimetry is based on the three component theory of color vision, which states that the eye possesses receptors for three primary colors (red, green, blue) and that all colors are seen as mixtures of these three primary colors.The most important system is the 1931 Commission Internationale I’Eclairage (CIE) system, which defined the Standard Observer to have color-matching functions x(*), y(*), and z(*) as shown in Fig. 2.4.4.1. The XYZ tristimulus values are calculated using these three standard observer color matching functions. XYZ tristimulus values and the associated Yxy color space form the foundation of the present CIE color space.
CIE 1931 Yxy Chromaticity Chart
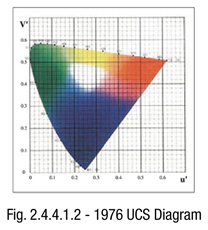
The tristimulus values XYZ are useful for defining a color, but the results are not easily visualized. Because of this, CIE defined a color space in 1931 for graphing color into two dimensions independent of lightness; this is the Yxy color space, in which Y is the lightness and x and y are the chromaticity coordinates calculated from the tristimulus value XYZ.The x and y chromaticity coordinates are calculated from the XYZ tristimulus values according to the following formulae:
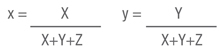
The principal drawback of the 1931 system is that equal distances on the chart do not represent equal perceived color differences because of non-linearities in the human eye.
CIE 1976 UCS Chromaticity Chart
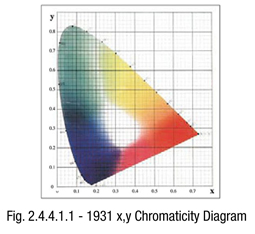
The Uniform Chromaticity Scale (UCS) was developed to minimize the limitations of the 1931 system. It was intended to provide a perceptually more uniform color spacing for colors at approximately the same luminance. The 1976 CIE UCS chart uses u’ and v’ coordinates. The symbols u’ and v’ were chosen to differentiate from the u and v coordinates of the similar but short lived 1960 CIE-UCS system. The u’ and v’ chromaticity coordinates are also calculated from the XYZ tristimulus values according to the following formulae:
Colorimetry (cont.)
Helmholtz Coordinates
An alternative set of coordinates in the CIE system,Dominant Wavelength and Purity (also known as Helmholtz coordinates), correlate more closely with the visual aspects of hue and chroma. The dominant wavelength (DW) of a color is the wavelength of the spectrum color whose chromaticity is on the same straight line as the sample point (S) and the illuminant point (N) (for light source measurement, the illuminant point is x=0.333 and y=0.333). Purity, also known as excitation purity, is the distance from the illuminant point (N) to the sample point(S), divided by that from the illuminant point (N) to the spectrum locus (DW).
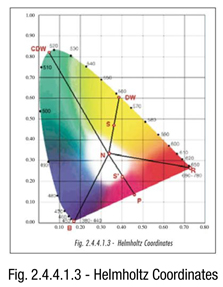
Purity = (N-S) / (N-DW)
The above method is only applicable to spectral color, that is color which appears in visible spectrum. When measurement of non-spectral color, that is color which does not appear in visible spectrum and is located within the triangle area encompassed by the 3 points N, R and B, is concerned, Complementary Dominant Wavelength (CDW) is used. This is because the interception point P, which is supposed to be the Dominant Wavelength has no corresponding wavelength. The line from N to P is extended backward in order to determine the Complementary Dominant Wavelength (CDW). Purity for non-spectral color is calculated from:
Purity = (N-S’) / (N-P)
Dominant wavelength and purity are commonly used in LEDs’ color specification.
Color Temperature
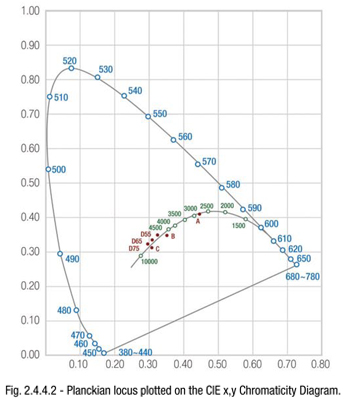
The concept of color temperature arises from the apparent color changes of an object when it is heated to various temperatures. When the temperature of an object increases, the emitted radiation changes which result in the change of color. A special class of incandescent (glow when hot) object emits radiation with 100 percent efficiency when heated;scientists call this ideal full radiator as blackbody radiator.
In particular, an ideal blackbody glows with a color which depends on its temperature. The range of hues may be shown on the CIE diagram by a line which is referred to as a blackbody locus (or, Planckian locus). The color progresses from a very deep red through orange, yellow, white and finally bluish-white as the temperature increases. Most of the natural light sources, such as the sun, star, and fire fall very close to the Planckian locus.
Some light sources have color which corresponds to that of a full radiator when the latter is held at a particular temperature. For some purposes, it is convenient to classify such a light source by quoting its color temperature(measured in Kelvins). Color Temperature curves from 1,500K to 10,000K can be supplied. As long as the light being measured closely approximates a blackbody source, the results are quite accurate. Hence, the locus is particularly useful in the classification of ‘whites’. Color temperature is widely used among lamp and display manufacturers.
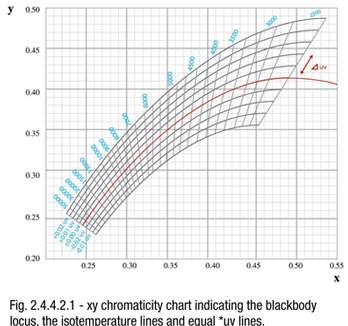
Correlated Color Temperature
Color temperature is strictly applicable to light sources which may be precisely matched by a full radiator. The concept is extended to include sources which give light that can be closely – but not exactly – matched by a full radiator. The expression Correlated Color Temperature (CCT) is used to describe the light from such sources. This is the temperature at which a full radiator produces a light that most nearly matches the light from the given source. CCT is calculated by determining the iso temperature line on which the color of the light source is positioned. Iso temperature lines are straight lines for which all colors on the line appear visually equal. *uv is used to specify the deviation from the blackbody locus.The maximum deviation for *uv is set at ±0.02.
CCT is not suitable for measuring light sources which have narrow-band spectral emittance curves that do not approximate any blackbody curve (for example, LED).
Spectroradiometry
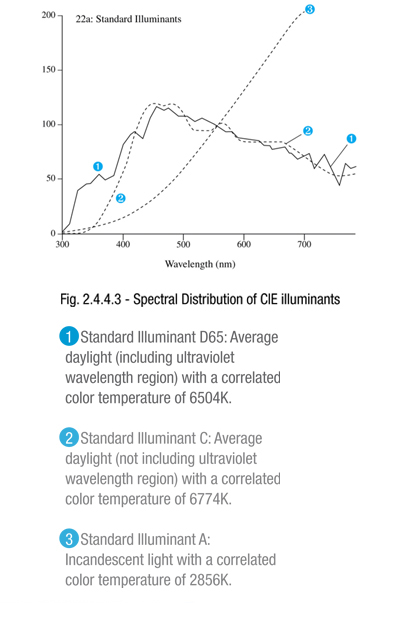
Many different spectral power distribution curves can yield the same visual effect which we call color. It means that the color of a light source does not tell us the nature of its spectral power distribution. In other words, two different light sources which have the same color in x,y or color temperature might not exhibit the same spectral power distribution. The reverse, however, is true: knowledge of spectral power distribution of light will enable us to describe the color (refer to Fig. 2.4.4.3 for the types of spectral power distribution curve of some common CIE illuminants).
Hence, the spectroradiometric method is the most accurate and complete method of specifying color. The spectral data can be analyzed visually and/or compared to data from another light source. However, the best use of spectral data is to calculate the CIE tristimulus values by mathematically integrating the data with the CIE color-matching function.The tristimulus values are then used to compute CIE chromaticity coordinates and luminosity, which provide complete description of the color.