Fat Content In Ground Meat
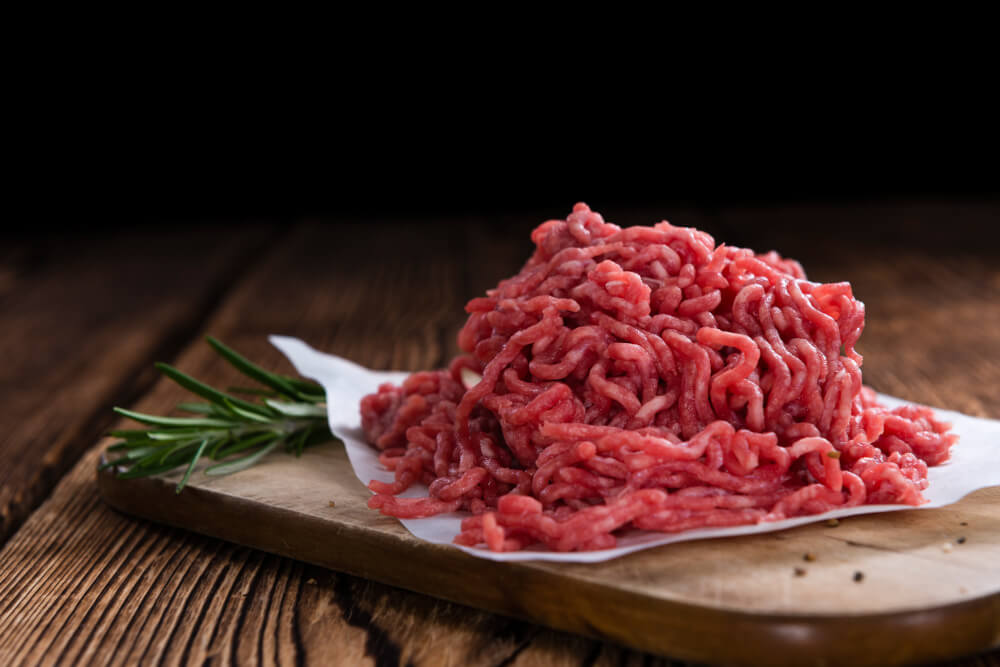
For this study, five meat samples were obtained and mixed to create ten samples for analysis. To know their fat content accurately, Specim ordered measurements from a 3rd party laboratory, Seilab. According to the Gerber method, they are certified in fat analysis, using a butyrometer (Seilab in Seinäjoki, Finland; method NMKL 181, 2005; see Table 1 below).
| Measured value by Seilab | Measured value by FX17 | |
| Sample 1 | 0.6% | 0.9% |
| Sample 2 | 16% | 15.2% |
| Sample 3 * | 10% | 10.4% |
| Sample 4 * | 18% | 20.8% |
| Sample 5 | 75% | 75.1% |
| Sample 6 (mix) | 3% | 2.7% |
| Sample 7 (mix) | 6% | 5.5.% |
| Sample 8 (mix) | 11% | 12.8% |
| Sample 9 (mix) | 19% | 19.0% |
| Sample 10 (mix) | 24% | 23.5% |
Table 1: fat content on each sample included in this study. Samples 3 and 4 were used for validation purposes.
We measured the samples with Specim FX17 hyperspectral camera (Fig.1). Hyperspectral imaging is a non-destructive method that combines spectroscopy and imaging. It collects NIR spectra for each pixel of the acquired image (900 – 1700 nm). Those can be converted into fat content employing relevant processing algorithms. Here a regression model was built and calibrated on eight samples and applied to the two remaining ones (indicated with * in Table 1).
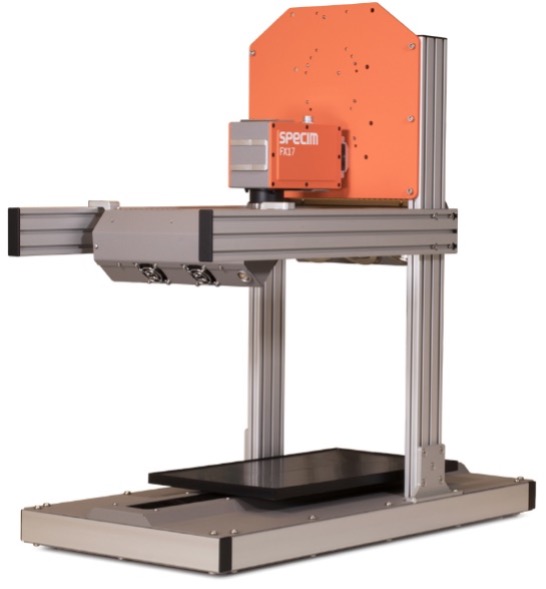
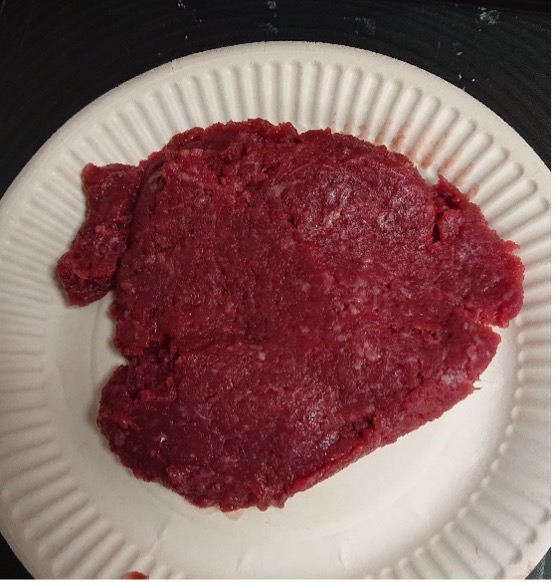
Figure 1: FX17 on the 40×20 scanner (left) and example of a sample on the scanner sample tray (right).
Table 1 and Fig. 2 show the regression model results. It indicates that the FX17 is a suitable tool for measuring the fat content in ground meat.
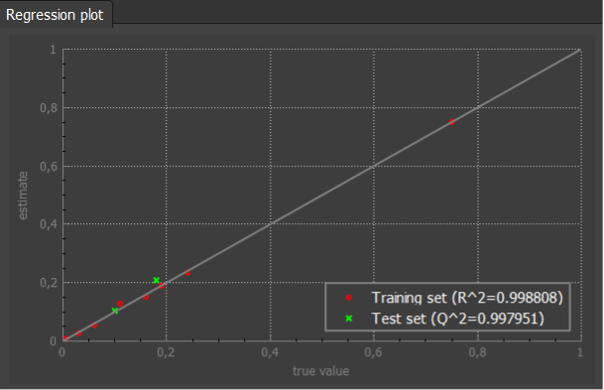
Figure 2: Regression plot of the quantitative model for fat content prediction. Red dots relate to calibration samples, whereas green ones relate to validation samples.
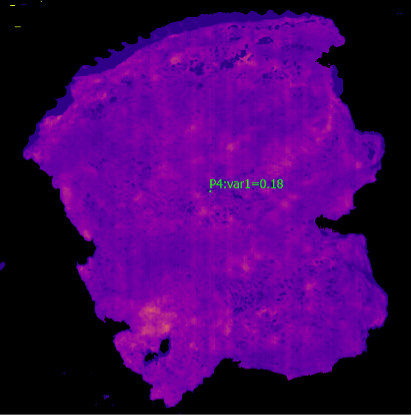
In addition to measuring the fat content in samples, hyperspectral imaging is suitable for measuring its distribution (Fig.3).
Conclusions:
Specim FX17 in machine vision systems will provide meat transformers with crucial and accurate fat quantification information. This fast and non-destructive method is also suitable for detecting other properties such as moisture and freshness. Furthermore, this method can sort contaminants such as pieces of wood and plastics. FX17 is a perfect tool for industrial quality control. Besides, the methods’ flexibility allows a fast adaptation to new regulations.
Hyperspectral imaging offers cost reduction and quick adaptation to new regulations by providing real-time information about the manufacturing process for decision-making and real-time control of meat processing factory input and output within specification.