
Measuring What the Human Eye Sees: The Future of Display Quality Testing
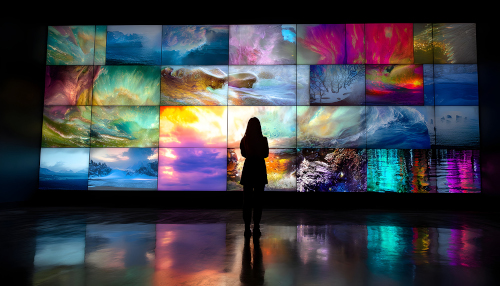
The brightness is correct. The color is within tolerance. The contrast ratio meets the requirement. The report looks good.
But when someone turns the display on, they notice something.
Maybe the center appears brighter than the edges. Maybe a faint pattern becomes visible against a gray background. Maybe the image feels uneven.
The measurements say the display passed.
The user sees something different.
That disconnect is becoming one of the biggest challenges in display development today.
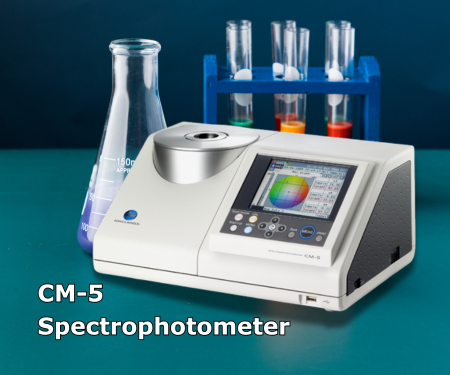
For years, display testing focused on measuring specific points on a screen. A luminance meter, spectroradiometer, or display color analyzer would measure brightness, color, and contrast at designated locations, providing accurate, repeatable data. Instruments such as the CA-527 Display Color Analyzer continue to play an important role in evaluating modern OLED, microLED, and HDR displays, particularly when precise luminance, chromaticity, and flicker measurements are required. [1] [2]
But displays have changed.
Modern OLED, microLED, and HDR technologies can deliver exceptional image quality. They produce deeper blacks, higher peak brightness, wider color gamuts, and greater contrast than previous generations. User expectations have risen just as quickly. What once went unnoticed now stands out immediately.
A slight variation in brightness can affect the perceived quality of a premium smartphone display. A subtle uniformity problem can become distracting on a large automotive screen. A small visual defect may be unacceptable in a medical or aerospace application where clear information is critical.
As display performance improves, manufacturers are discovering that measuring a few points is no longer enough. They need to understand how the entire display appears to the person looking at it.
This is where imaging-based measurement has changed the conversation.
Rather than collecting data from a single location, imaging photometers and imaging colorimeters evaluate the entire display at once. Millions of measurement points are captured in a single image, creating detailed maps of luminance, chromaticity, contrast, and uniformity. Engineers use systems such as Radiant ProMetric® imaging photometers and imaging colorimeters when they need to quantify display uniformity, evaluate mura, or identify defects that may be visible to users but difficult to detect through point measurements alone. [3] [4]
The difference is significant.
Instead of asking whether a single section of a display is within specification, engineers can evaluate how brightness varies across the entire screen. They can identify subtle mura, detect pixel-level defects, and visualize issues that may not be apparent through traditional point measurements alone.
More importantly, they can begin to evaluate the display in a way that better reflects human perception.
That shift matters because users do not experience displays one measurement point at a time.
They see the entire image.
They notice if the corners appear darker than the center. They notice uneven illumination. They notice when one section of the display looks different from the rest. In many cases, what drives quality perception is not a single measurement value but how all of those values come together visually.
This is particularly important in industries where display performance directly affects the user experience.
In consumer electronics, users expect consistent brightness and color across the entire display surface. Manufacturers often use imaging colorimeters alongside traditional measurement instruments to evaluate uniformity and visual quality before products reach the market. [5] [6]
In automotive applications, instrument clusters, infotainment systems, and head-up displays must remain readable under a wide range of ambient lighting conditions. Engineers frequently combine spot-measurement instruments for luminance verification with imaging systems that assess visual consistency, contrast, and uniformity across the entire display area. [7] [8]
Medical displays present a different challenge. Diagnostic confidence often depends on accurate grayscale reproduction and consistent luminance across the screen. Even subtle variations can affect how information is perceived, underscoring the importance of comprehensive display evaluation.
AR and VR displays introduce yet another level of complexity. Because the display is positioned only millimeters from the user’s eyes, even small artifacts can become highly visible. Evaluating these systems often requires specialized near-eye measurement solutions that replicate the geometry of human vision and assess characteristics such as brightness, color, field of view, uniformity, and image quality from the wearer’s perspective. [9] [10]
As displays become brighter and more complex, measuring wide dynamic ranges also becomes increasingly important. Engineers developing HDR displays often rely on high-performance spectroradiometers to accurately evaluate both extremely dark and very bright regions of a display. Konica Minolta Sensing developed instruments such as the CS-3000 HDR spectroradiometer to address these demanding measurement requirements. [11]
To support these evolving applications, we design modern imaging measurement systems to capture characteristics that closely relate to how people view displays in the real world. High spatial resolution helps reveal fine defects and non-uniformities. Wide dynamic range enables accurate measurement of both dark and bright regions. Advanced software tools allow engineers to visualize results, automate defect detection, and establish quality criteria based on visual thresholds. [12] [13]
The goal is not to replace traditional measurement methods.
The goal is to build upon them.
Spot measurements remain essential for obtaining highly accurate luminance, color, and spectral data. Imaging systems add another layer of understanding by showing how those measurements translate into a visual experience. Together, these tools provide a more complete picture of display quality.
That understanding is becoming increasingly valuable on the production floor. We use imaging measurement systems for inline inspection, end-of-line quality control, defect detection, and process optimization. By identifying issues earlier, manufacturers can improve consistency, increase yield, and reduce costly rework. [14] [15]
The technology continues to evolve, but the objective remains remarkably simple.
We need to measure displays the way people view them.
Because at the end of the day, customers do not buy luminance values, chromaticity coordinates, or specification sheets.
They buy what they see.
[1]The Inside Scoop On In-Flight Lights – Konica Minolta Sensing
[2]The Invisible Challenge of Immersive Reality: How to Measure AR/VR …
[3]Blogs – Konica Minolta Sensing
[4]ITC RFQ data FY 2023 – To Date
[5]ITC RFQ data FY 2023 – To Date
[6]Blogs – Konica Minolta Sensing
[7]Blogs – Konica Minolta Sensing
[8]More Ways to Measure XR Displays – Radiant Vision Systems
[9]Method for Repeatable Measurement of Sparkle in Anti-Glare Displays
[10]Methods for Measuring Display Defects and Mura as Correlated to Human …
[11]The Invisible Challenge of Immersive Reality: How to Measure AR/VR …
[12]Blogs – Konica Minolta Sensing
[13]How to Use Imaging Colorimeters for Automated Visual Inspection of …