
LumiCam Software
Click to Enlarge Thumbnails

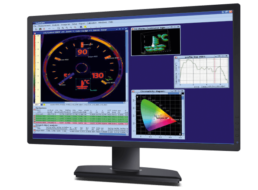
The LumiCam Software has been specifically developed for the LumiCam 2400B cameras. The program is designed to provide display options of the captured data and comprehensive analysis. Color and luminance maps can be displayed in freely definable false color projections. There are a number of display options available:
LumiCam Software also comes with a number of powerful analysis tools specially designed to meet the requirements of display applications for the automotive industry:
- Distribution of luminance
- Color temperature
- ΔE, with reference color determined either manually or with a spotmeter
- RGB color image
- x, y, z and u’, v’ color coordinates
- Color saturation and dominant wavelength
Conveniently copy all data sets to the clipboard and copy the data into Excel. Pass/Fail testing criteria can also be included in measurements. When all your measurements are complete, LumiCam Software allows you to create specialized reports to document specific findings.
The new generation LumiCam models has a motorized lens and aperture setting that can be controlled via the LumiCam software. This results in ease of operation, greater flexibility and precision, accompanied by a high measurement speed.

Existing Customer?
If you're looking for service support or help with calibration then complete a service request form and we'll get right back to you
Features
LumiCam software also has many powerful tools that make analysis quick and accurate. These color measurement software tools were developed to meet the automotive industry’s display application requirements:
- Users can place the spotmeter in whatever number and size is necessary. In each spotmeter, average, maximum and minimum luminance values along with color coordinates and other colormetric parameters can be automatically determined. The color coordinates are then viewable on a CIE diagram.
- When polygons are used, an object can be analyzed as to its contrast and also its average, maximum and minimum luminance including both target and background areas.
- Visualizing a 3D rendering of luminance distribution is possible with our powerful 3D display. You can select the area of interest and easily rotate it across all spatial axes.
- Users can rapidly evaluate a cross section within luminance distribution with the object profile. This particular function is ideal for speedometer needle and profile section analysis.
With this advanced color measurement software, users can take data sets created by the analytic tools and quickly paste them on the clipboard and from there into Microsoft Excel. LumiCam software also allows for the definition of individual Pass/Fail test criteria. Comprehensive reporting capabilities are a final component of this highly functional photo measurement software.